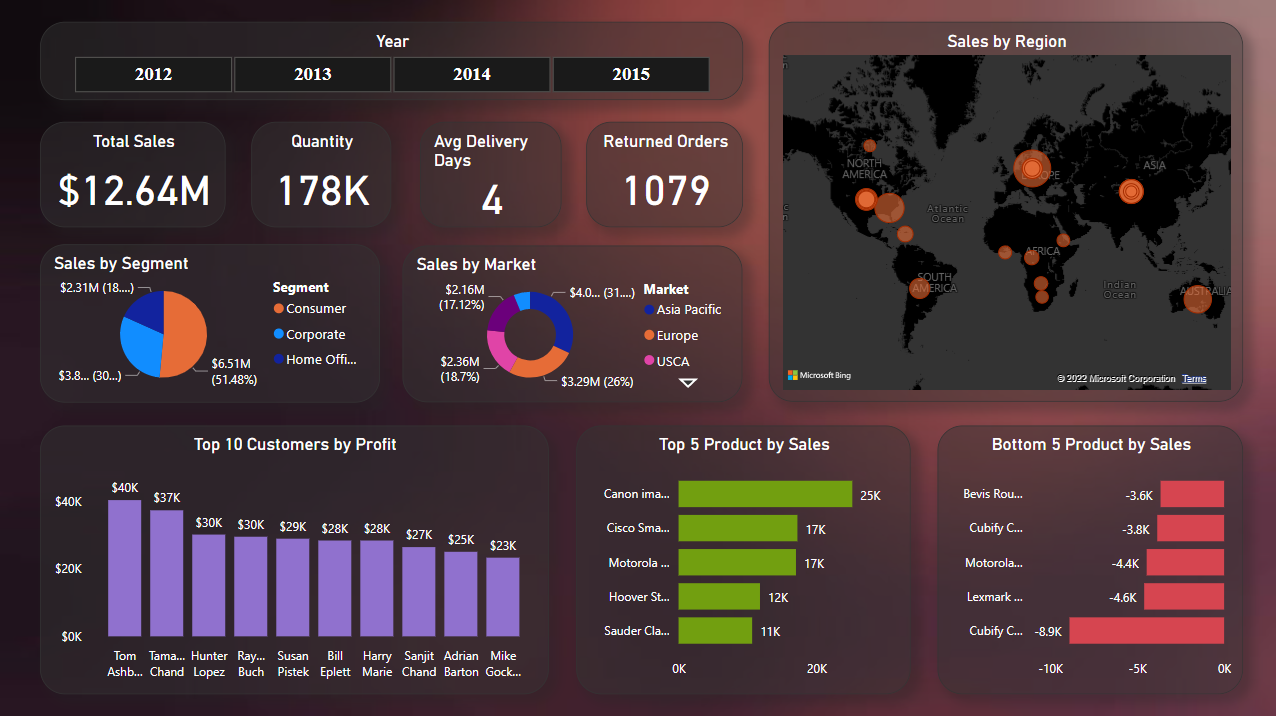
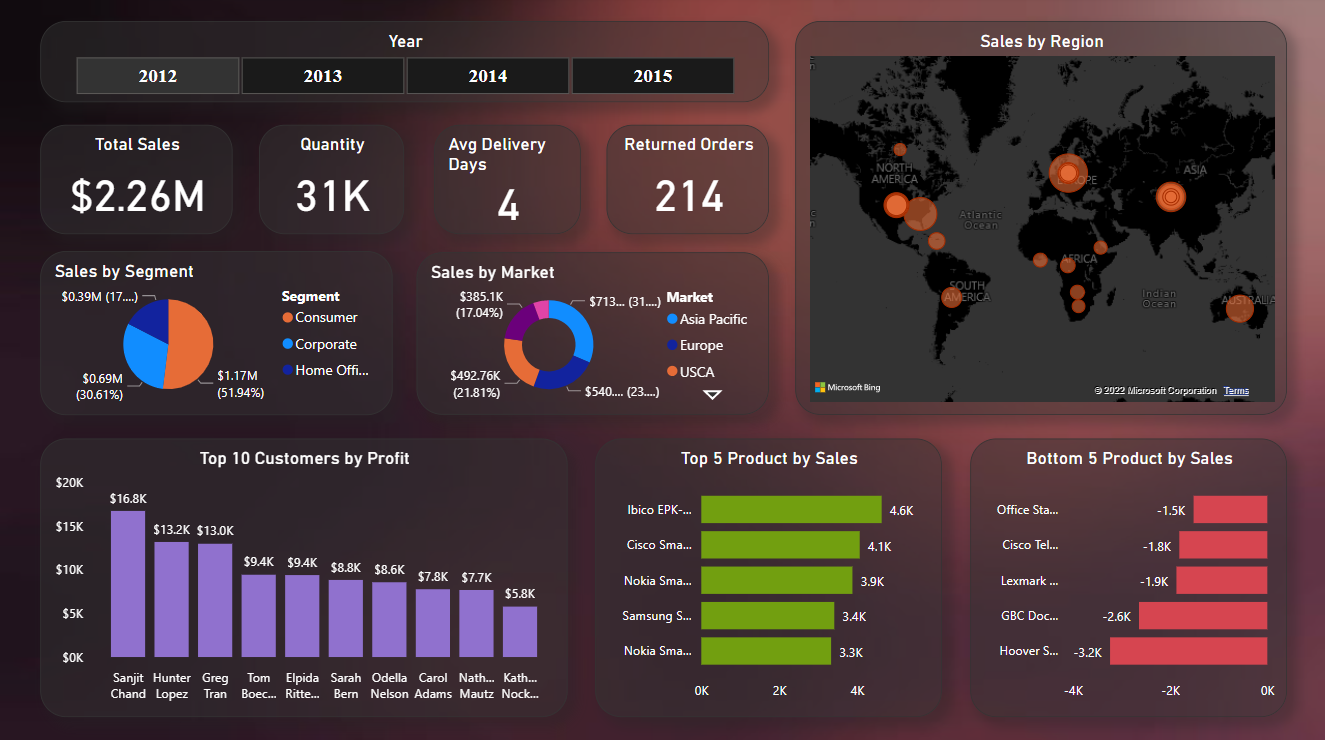
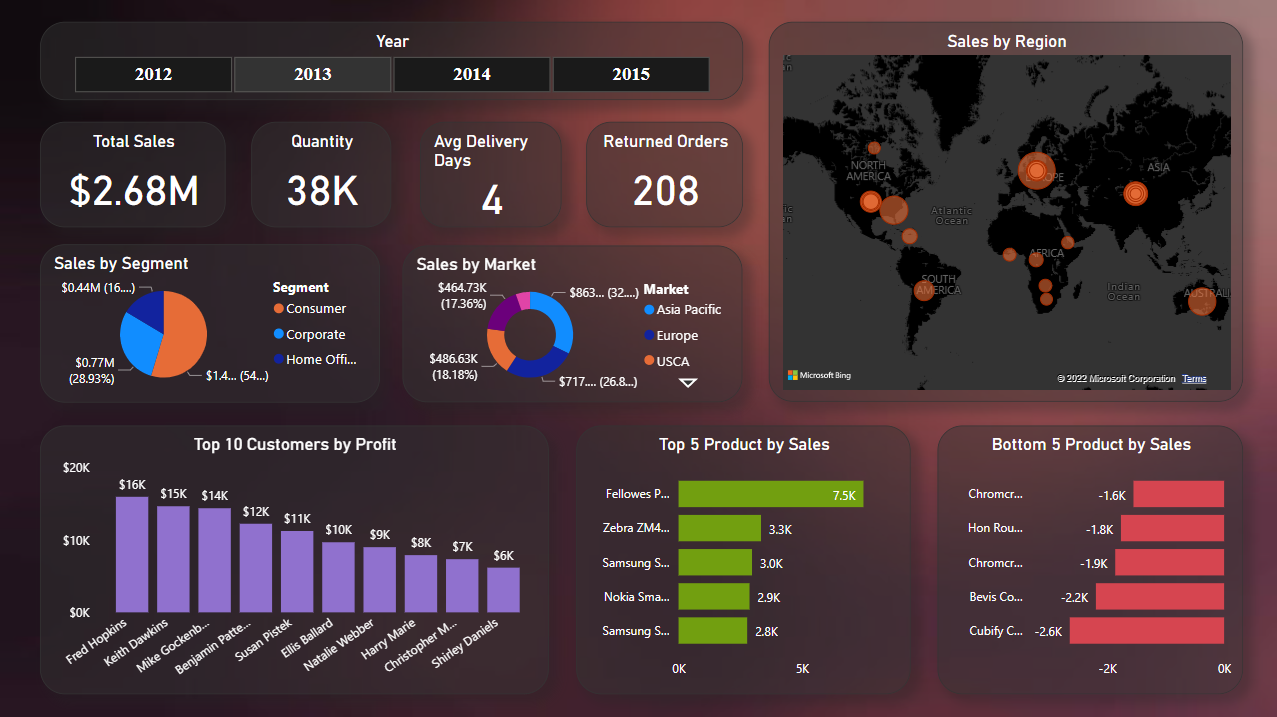
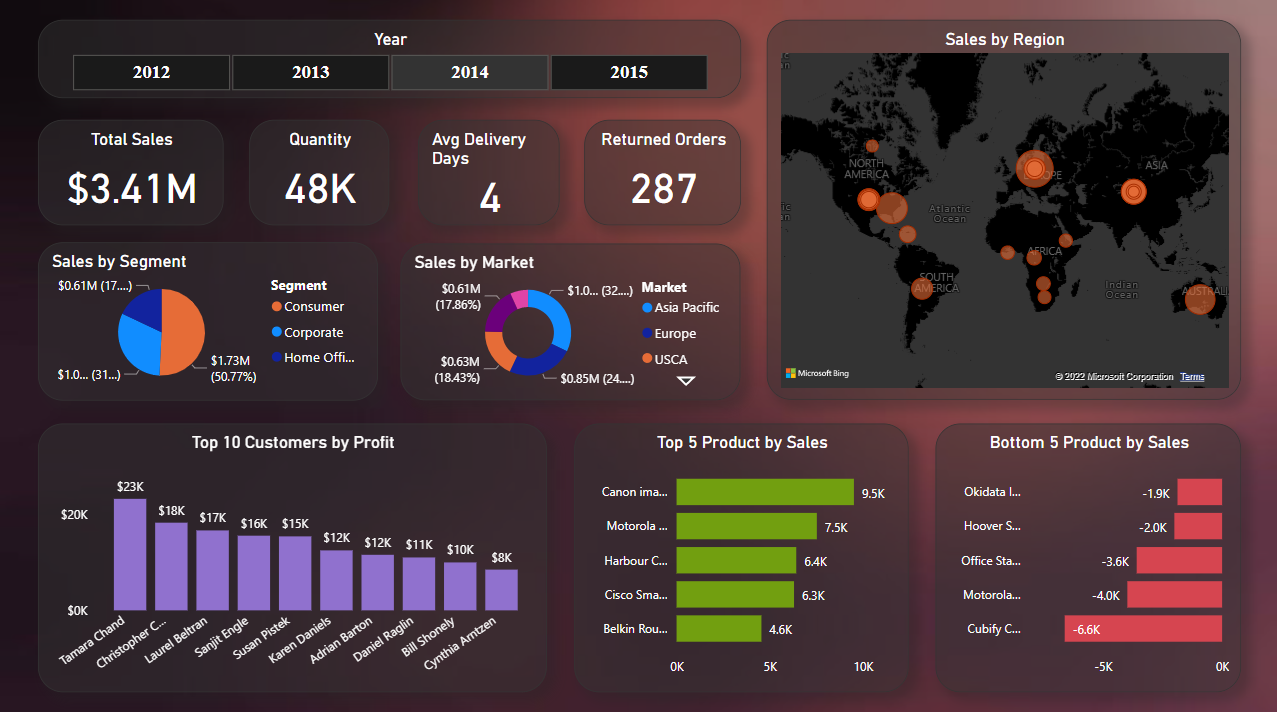
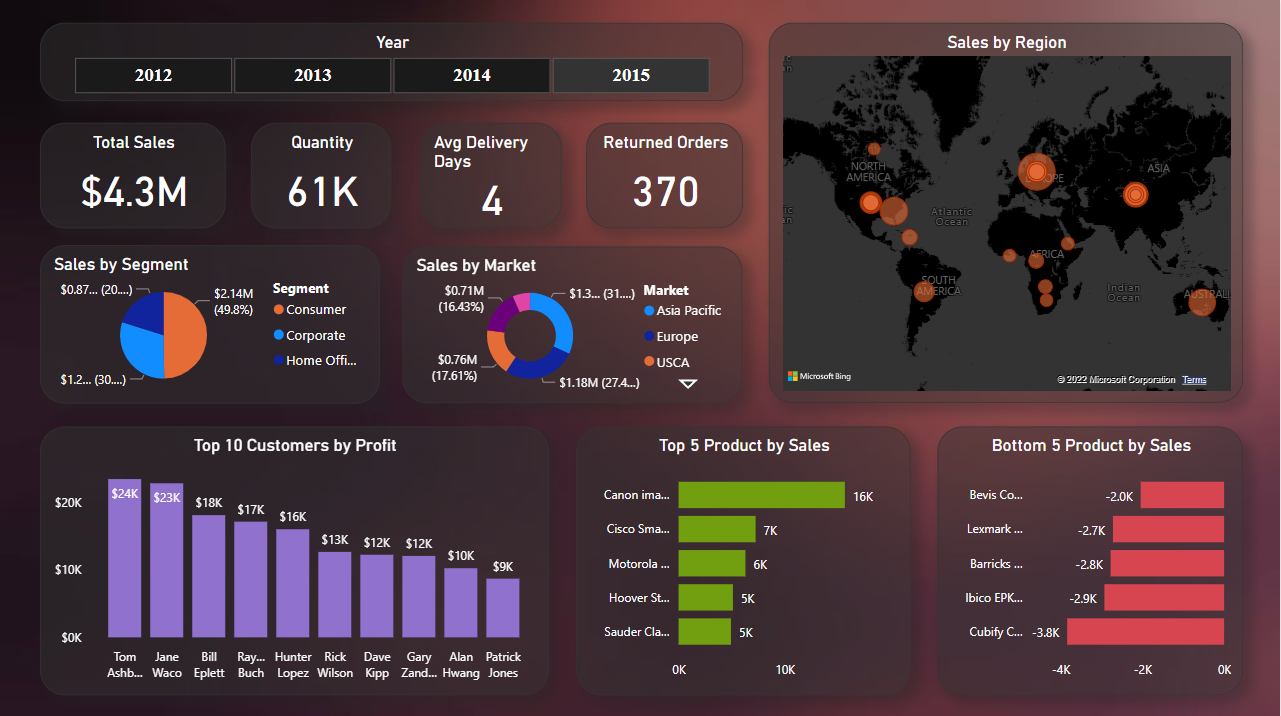
Superstore Dashboard using Power bi
an interactive superstore dashboard in power bi using a slicer in the year. The Dashboard contains sales by region map, total sales, quantity average delivery date, orders returned, sales by segment, sales by market, top 10 customers by profit, top 5 product sales, and bottom 5 sales by product.